Je bent je ingevulde velden bij deze pagina aan het verwijderen. Ben je zeker dat je dit wilt doen?
You are erasing your filled-in fields on this page. Are you sure that is what you want?
Nieuwe Versie BeschikbaarNew Version Available
Er is een update van deze pagina. Als je update naar de meest recente versie, verlies je mogelijk je huidige antwoorden voor deze pagina. Hoe wil je verdergaan ?
There is an updated version of this page. If you update to the most recent version, then your current progress on this page will be erased. Regardless, your record of completion will remain. How would you like to proceed?
This section introduces the origin an application of graphing.
Yes, history in a math class, but this helps demonstrate both how natural the
Cartesian graphing system is, and where it came from... not to mention who invented
it.
As the (possibly apocryphal) story goes, Rene Descarte, a famous seventeenth
century philosopher
( He was the one who famously said “cogito ergo sum” ie “I
think, therefore I am.” )and mathematician, was sitting in bed one day with a
cold and watching a fly crawling across his ceiling. He started trying to
figure out how he’d describe the fly’s path to a friend later when he realized
that it would be easiest to just record the fly’s distance from two adjacent
walls of his room at each time of interest. By saying the fly was ‘3 inches
from the south wall and 4 inches from the east wall’ one could precisely
state the location of that fly at that moment, even if the fly was no longer
present. Thus he came up with the idea of the coordinate axis system, the
‘x-y plane’. We even named this plane after him; the so-called “Cartesian
Plane”.
Uses for the Cartesian plane and graphing
Graphing on the Cartesian plane has two (very) distinct uses. We will introduce the
most commonly used form (outside of academics) of Cartesian graphing
here, but for the rest of this class (and calculus one) we will only utilize the
second usage, which we cover in the next tile on how to graph to relate
variables.
Grid system and Dinosaurs!
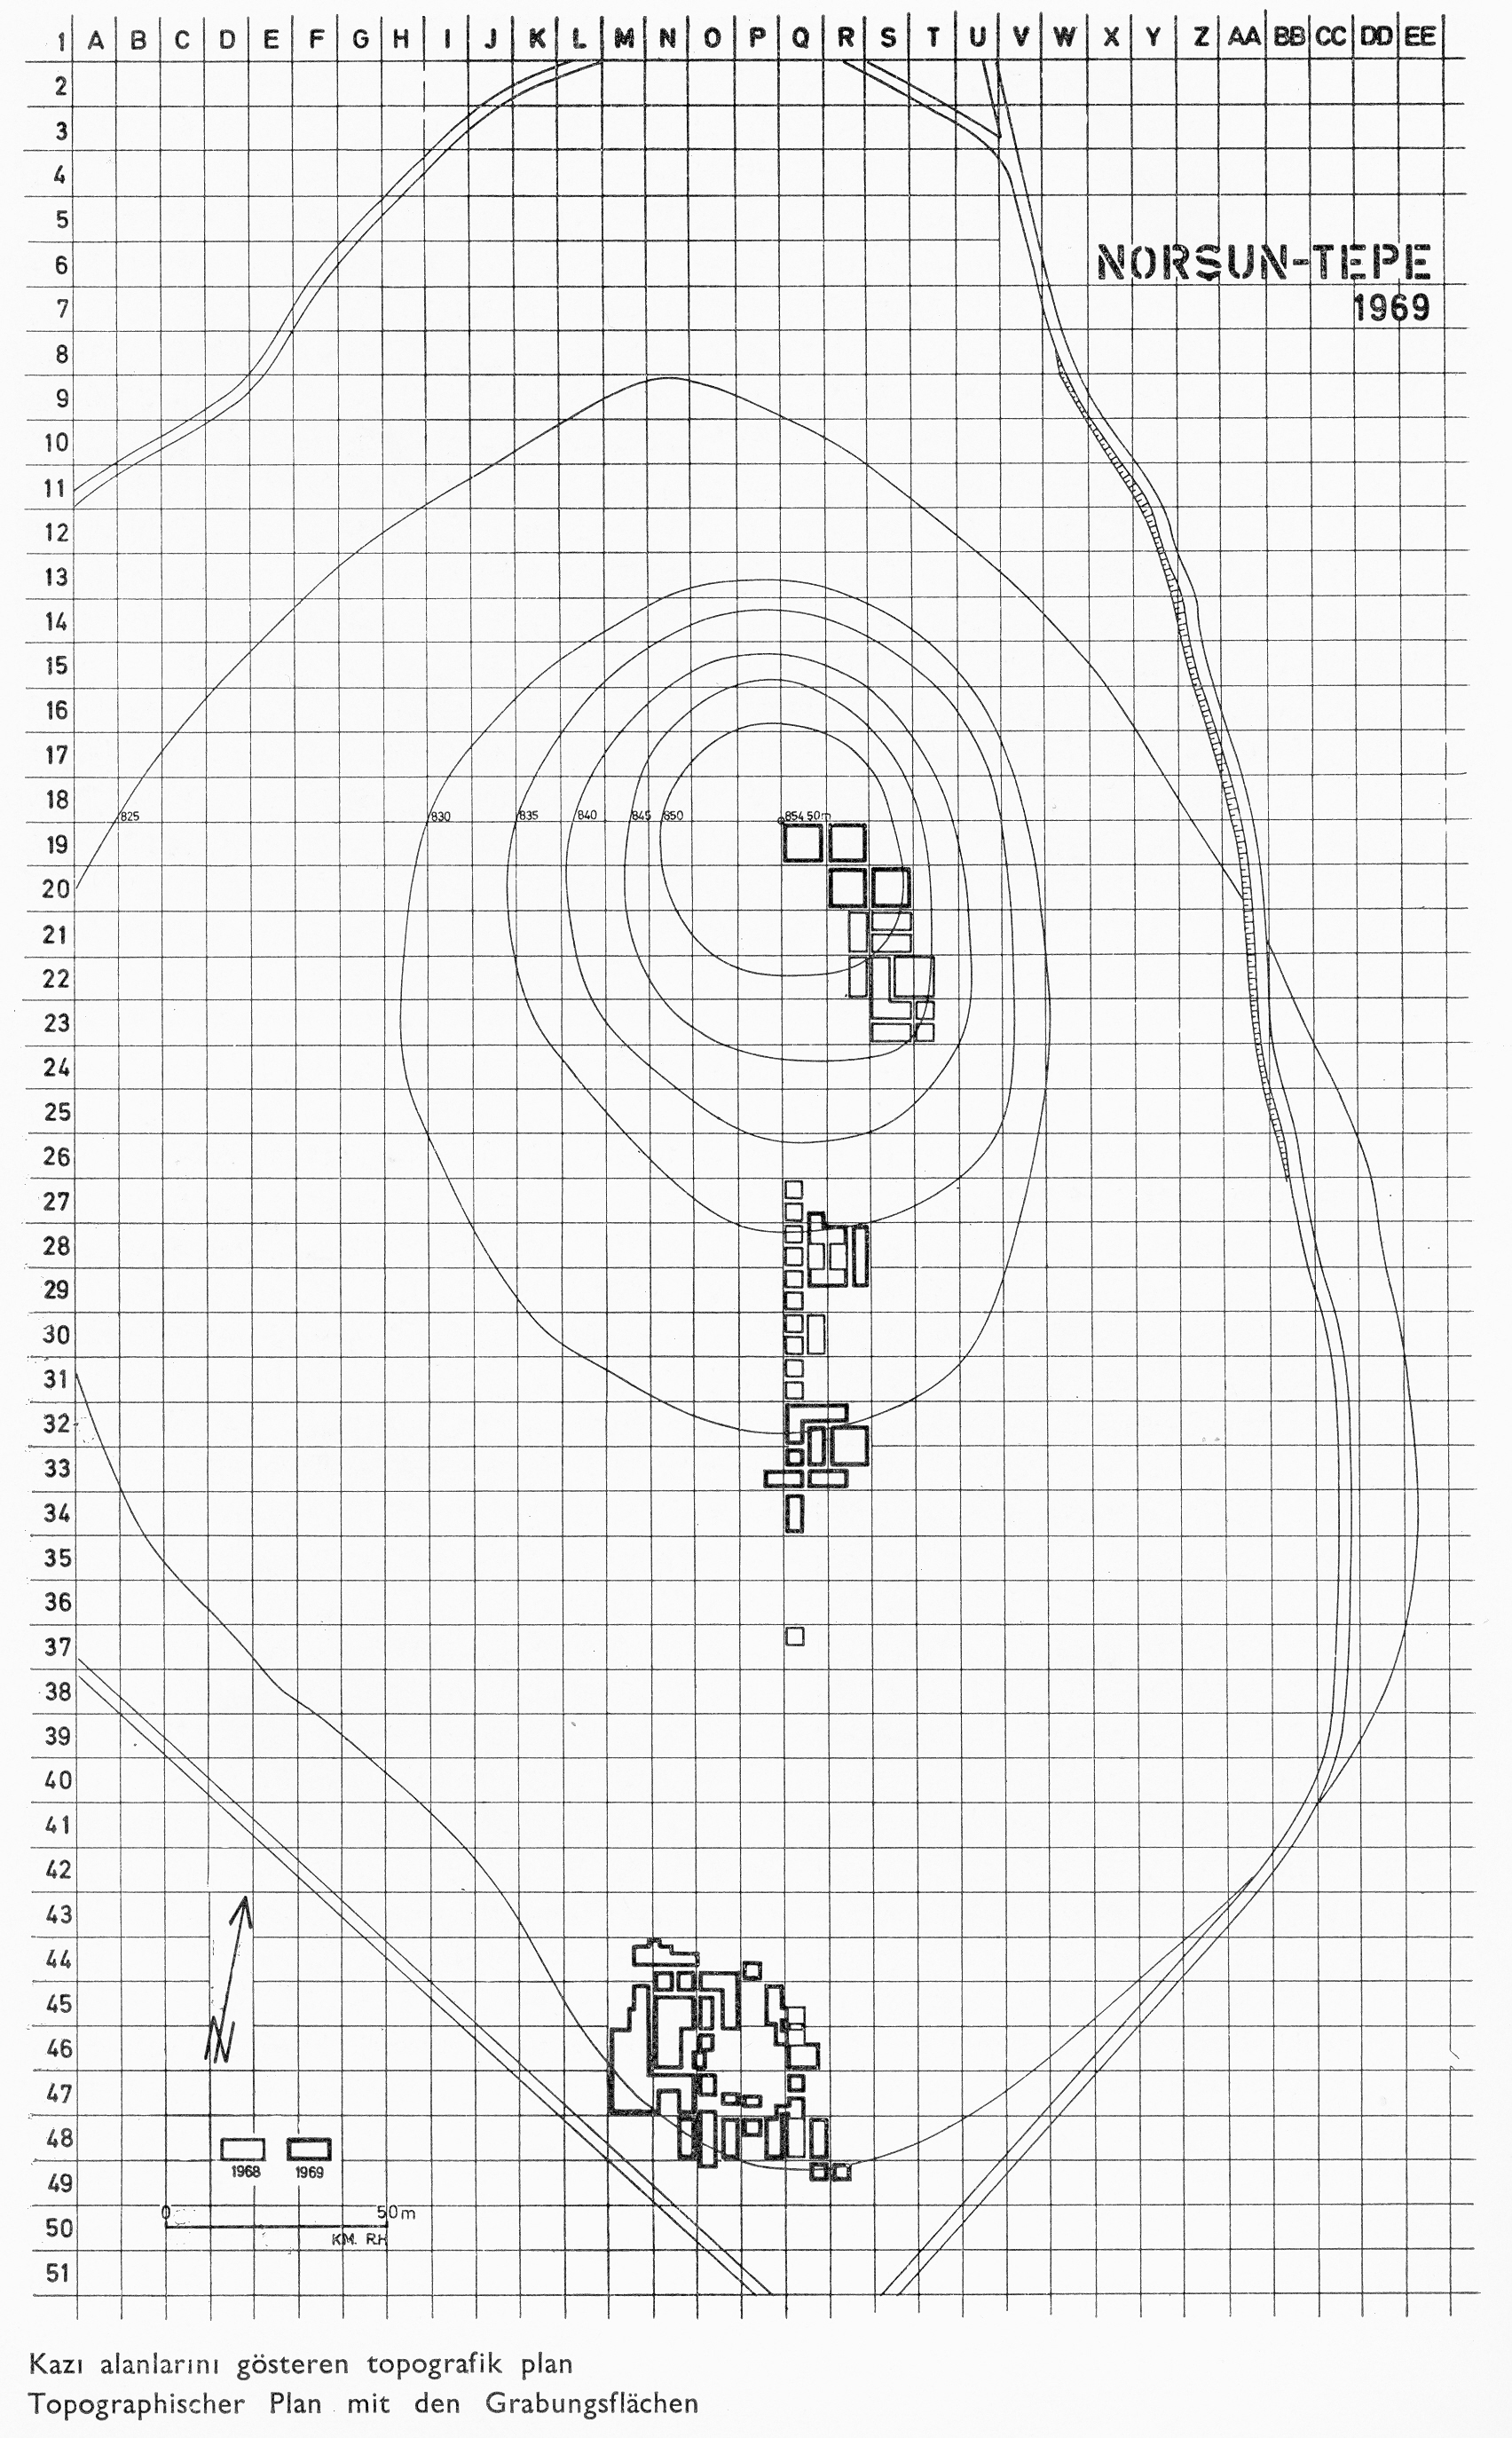
The first way that Cartesian graphing is commonly used is as a coordinate system to
allow one to be precise about the location of something that is found within a larger
context. A great example of this is when archaeological dig sites are documented. A
(properly) documented archaeology site will superimpose a grid over the entire
site, where one axis will be assigned numbers and the other axis will be
assigned letters. Thus you might have a grid where the East/West direction
is labeled with “A” at end and assigning a letter to each block across the
axis. Similarly the North/South most section could be labeled with a “1”
at one end, and labeling with progressively larger numbers along the axis
for each subsequent block. You would end up with something like Figure
gridMap
Figure 1: An actual archaeological digsite map of a religious site in
Turkey, originally drawn in 1963 and reprinted in 1969. Actual research and
corresponding archaeological digs didn’t begin until 1995.
So, who do we have to blame for learning graphing in the plane?
Math teachers.
They are clearly sadists.Whomever wrote the curriculum for this class.Rene
Descarte; and the stupid fly on his wall.I blame nobody. Or everybody. Definitely
everybody.
What type of graphing would most commonly be used by archaeologists or
landscapers?
Determining where major features are and/or as a way of sectioning
off land for further work or study.A way to differentiate who is going to work
where to determine payment.Determining the age of the land in order to
setup a heirarchy for what to work on first.They don’t use graphing.
 Precalculus Algebra MAC1140