Je bent je ingevulde velden bij deze pagina aan het verwijderen. Ben je zeker dat je dit wilt doen?
You are erasing your filled-in fields on this page. Are you sure that is what you want?
Nieuwe Versie BeschikbaarNew Version Available
Er is een update van deze pagina. Als je update naar de meest recente versie, verlies je mogelijk je huidige antwoorden voor deze pagina. Hoe wil je verdergaan ?
There is an updated version of this page. If you update to the most recent version, then your current progress on this page will be erased. Regardless, your record of completion will remain. How would you like to proceed?
This section discusses the geometric view of piecewise functions.
Here is the video lecture for this section:
_
We’ve discussed several types of functions at this point, as well as common uses for
each. Unsurprisingly however, the real world often does not conform to the ideal
function types. Even if the data for your model did perfectly conform to your
function, there’s a good chance that changes will occur at some point down the line.
Contrary to popular belief however, mathematics doesn’t need to idealize
reality in order to model it. (Although, in fairness, the more realistic of
a model that you want, the deeper and more difficult the math becomes.
Indeed, most of graduate school applied mathematics is about figuring out how
to remove idealizing assumptions, one after another, from your models to
get a progressively more realistic model.) Perhaps the most common and
simple (as such things go anyway) difficulties with models is when the data
changes the function it conforms to at various points in time. The obvious
solution would be to make a different function for each time period and
somehow ’stitch’ them together. This is exactly what a piecewise function
does.
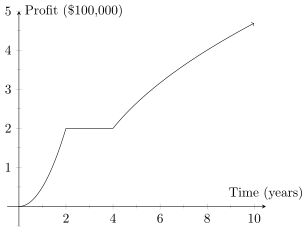
Suppose, for example, you are graphing the profit trends for your company over the
first decade of it’s operation. For the first two years, your company had a cornerstone
on the market for its product; and after some marketing, profits shot up quickly. In
the second year however, competition and difficulties in R&D stagnated profits, and
your company just barely managed to keep profit levels stable, neither increasing or
decreasing, for two years. Finally after those two years of research and development
and corporate consolidation, your company began expanding again, albeit not as
quickly as it did before.
There is clearly no single function that comes to mind to represent all these very
different segments of growth and difficulty simultaneously. Indeed, just by the
description we can see that the difficulty is that there are three very distinct periods
of time in which the nature of the profit is very different. Any one of these periods
should be something we can write a function for, but a single function for all three
simultaneously would be incredibly difficult. (Technically there is a theorem in
mathematics that claims such a function exists, but writing it down would be
unnecessarily difficult, and perhaps even impossible, for a human. Let alone coming
up with the function.)
Nonetheless we know the graph should look something like the following:
As we can see, this graph literally appears to be three distinct functions stitched
together at and . This is exactly the purpose of piecewise functions. As we will see in
the analytic viewpoint section, writing this function is “simple”, yet it can be subtle
and tricky. The real trouble comes in at the points where you are trying to
stitch the functions together; there is no reason (mathematically) that the
functions must actually lineup and stay connected. However, that is usually
what you want in your models, meaning you need to be careful when writing
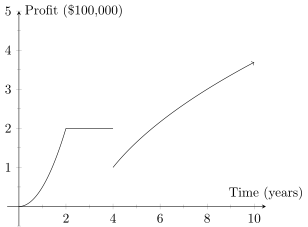
the function. Take, for example, this slightly altered version of the same
graph:
A small typo, or miscalculation can lead to some very strange looking model graphs,
and worse (as we’ll see in the analytic section) these typos can be incredibly difficult
to spot purely based on the function, without a graph.
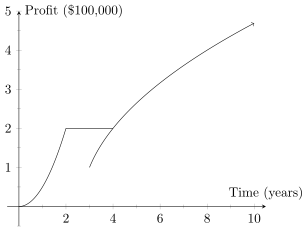
Worse even, the thing we get may not be a function at all. Consider, for example, the
following;
This graph clearly fails the vertical line test, and isn’t even a function. Fortunately
this particular issue is something that can be easily noticed in the analytic form of
the function, without needing a graph.
So, in short, the point of a piecewise function is to give us a tool that allows us to
‘stitch together’ different functions, one after another, to account for when
circumstances change during a model’s domain and different functions are needed to
represent various segments of the model. Exactly how we do that analytically will be
covered in the next tile.
 Precalculus Algebra