Je bent je ingevulde velden bij deze pagina aan het verwijderen. Ben je zeker dat je dit wilt doen?
You are erasing your filled-in fields on this page. Are you sure that is what you want?
Nieuwe Versie BeschikbaarNew Version Available
Er is een update van deze pagina. Als je update naar de meest recente versie, verlies je mogelijk je huidige antwoorden voor deze pagina. Hoe wil je verdergaan ?
There is an updated version of this page. If you update to the most recent version, then your current progress on this page will be erased. Regardless, your record of completion will remain. How would you like to proceed?
We discuss how to graph absolute values, as well as some key features of the graph.
Graphing absolute values may seem difficult at first glance, but as we’ll see, the process is one we’ve actually already
discussed.
Lecture Video
_
Text and details
Graphing absolute values is actually the same process as graphing piecewise functions. Upon further reflection, this shouldn’t
actually be surprising, since absolute values are - as we’ve seen - really just shorthand for a piecewise function. So, the process of
graphing absolute values is essentially just a matter of converting the absolute value to the piecewise definition, and then graphing
that as any other piecewise function.
Consider the function . The first step is to convert this to its piecewise form, which means we want to set
the inside of the absolute values greater than or equal to 0 and solve to get: , thus . Thus, in this case we have
that:
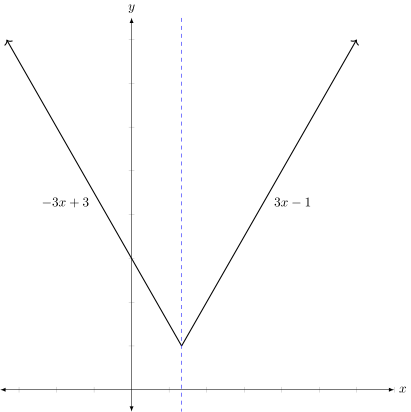
Now we graph this function as normal, in particular we want to graph the segment that is left of the transition point and then
the segment to the right of the transition point.
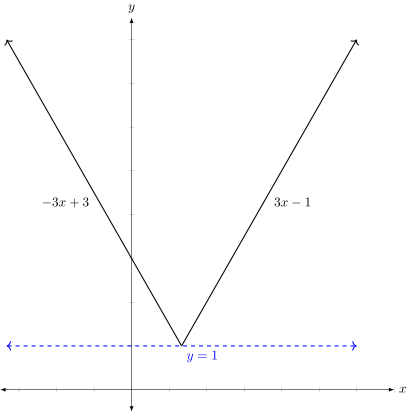
Notice that the graph appears to “bounce” off some horizontal line - specifically the line where the absolute value is 0. With a
quick computation we can see that if the inside of the absolute value is zero, then is the horizontal line that the absolute value
graph seems to “bounce” off of, as we can see more clearly here:
This kind of reflection making a sharp corner is indicative of an absolute value graph.
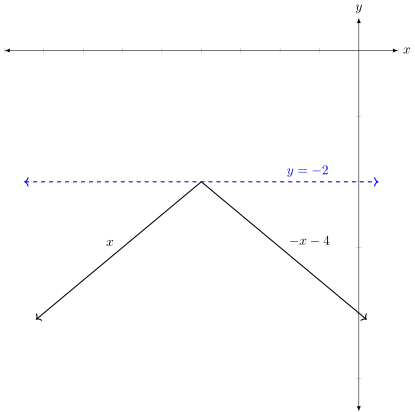
Also notice that, although absolute values always make things positive, that doesn’t mean the graph has to be positive.
Consider the function . The piecewise function form is then:
Graphing this gives:
Notice that the graph is not only entirely negative, but it is also pointing down, but it still has that tell-tale sharp corner where
it appears to “bounce” off the relevant line.
 Precalculus Algebra