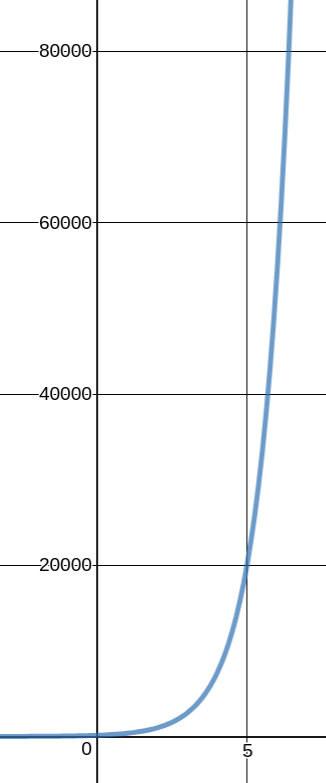
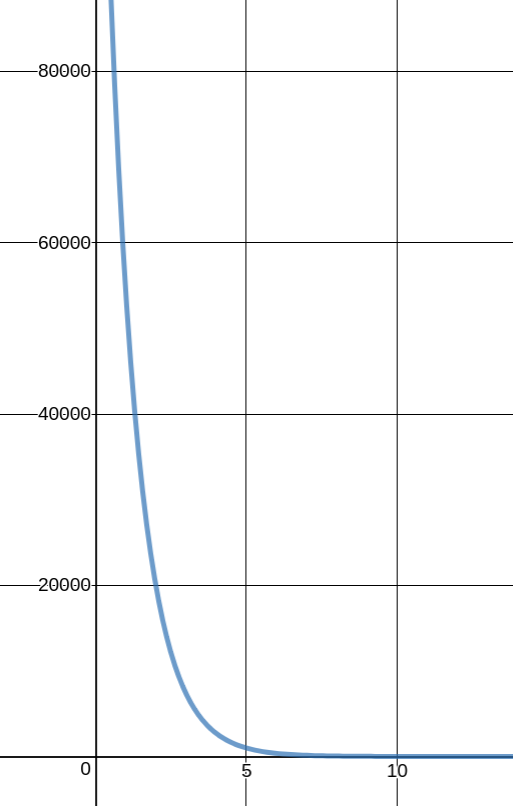
We know the blue line is an exponential function because it is near and we know the green line is a logarithmic function because it is near .
Link to textbook: Identify when a real-world situation would require an exponential model.
Note: There is currently no video for this objective. This activity is built as an “interactive activity”, akin to what you would expect in a live lecture.
Introduction
Now that we have looked at logarithmic models, we can look at their natural counter-part: exponential models.
Need for an Exponential Model
A exponential model is appropriate when the quantities change slowly at first, then rapidly later on.
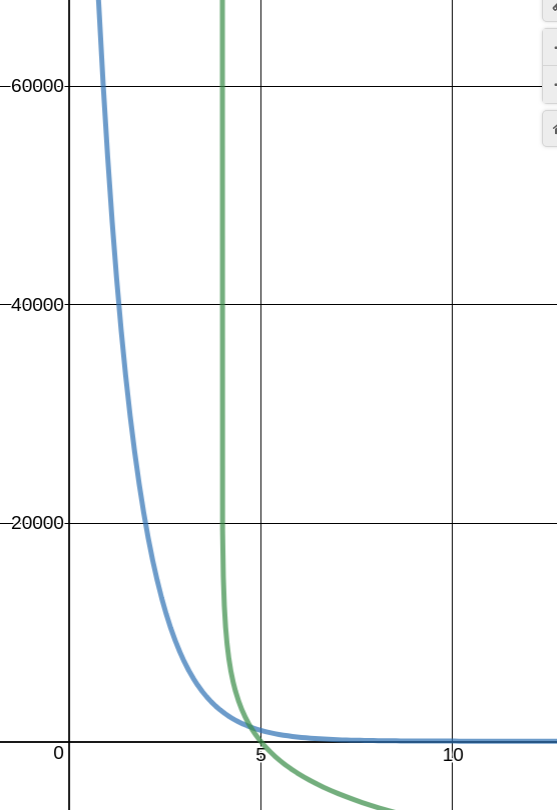
We saw this issue before: it is extremely difficult to distinguish between and just based on rates of change! Let’s look closer at two examples below:
Use the words “bounded” and “unbounded” to describe the difference between these
two functions.
Common Exponential Models
- Bacterial (unbounded) growth: , where is the initial bacteria population, is the rate the bacteria multiply, and is time.
- Population (bounded) growth: , where is the carrying capacity, is the initial population, and is the rate of growth.
- Continuously compounded interest: , where is the principle (initial money), is the rate of interest, and is time.
- Newton’s Law of Cooling: , where is time, is the difference between initial temperature of object and surroundings, and is the continuous rate of cooling of the object. This model would be used to determine how long a body has been deceased for.
- SIS Model: This describes the infection of a population when the infection does not provide any resistance after infection. Rather than provide an explicit equation, check out this dynamic figure (keep vaccination at 0 to see what an SIS model looks like).
Identifying Exponential Models
Your bank offers a savings account that will increase your total balance by 0.2%
annually. You want to decide how much to initially deposit and if the initial deposit
makes a big difference in the long run. Should we model this scenario using an
exponential function?
Compound interest can be modeled by , were is the principle (initial money), is the
rate of interest, is time, and is the number of times it compounds per time
unit in . Even though the base is not , this is still an exponential function!
A population of bacteria doubles every hour. Should we model the scenario with an
exponential function?
Our two quantities are population and time (in hours). If we want it to double every
hour, we want to multiply by 2 every time increases - we would write that as .
Combining that with the initial population , we would get the equation . Again,
exponential functions are more than just - they are any number raised to your
variable.
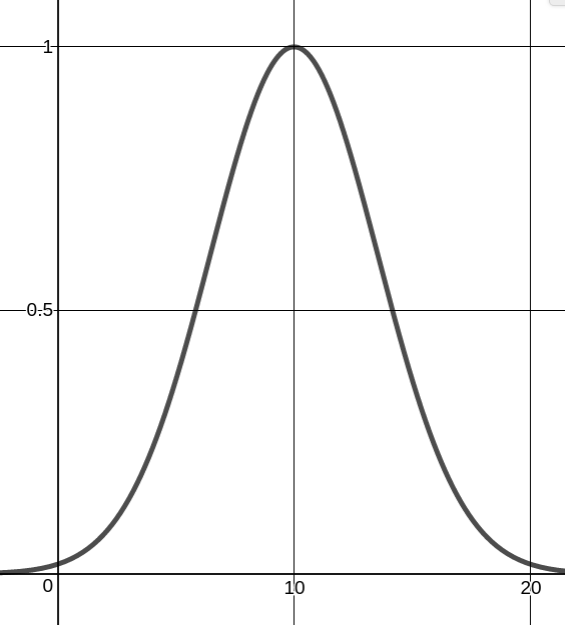
Should we model the normal distribution curve above by an exponential function?
Here is an example of why are heuristics are too simple: log and exponential
functions can have polynomials as variables rather than just . The picture above
is a translated version of . We can see the “exponential” patterns as we
approach 10 and as we move away from 10. You would not be expected to have
realized this on the exam, but this is just to show that exponential and
logarithmic functions can look very different from the elementary version and .